1. Introduction
EP-Atlas is a comprehensive database that systematically compiles enhancer–promoter RNA interactions (EPRIs). It integrates RNA interactome datasets derived from RIC-seq, KARR-seq, LIGR-seq, SPLASH, and PARIS across ten human cell lines. The current release includes 980,639 high-confidence interactions, each extensively annotated with gene information, expression profiles, genomic interaction regions, chimeric read counts, histone modification states, and genetic variants from GWAS Catalog, ClinVar, and ICGC, as well as expression quantitative trait loci (eQTLs) from PanQTL v2 and ncRNA-eQTL databases. EP-Atlas thus provides a unique platform for exploring cell-type-specific, RNA-mediated enhancer–promoter regulatory networks and for interpreting the functional impact of noncoding variation on human traits and diseases.
2. Annotation of promoters, typical-enhancers, and super-enhancers
To define promoter and enhancer regions, we collected H3K4me3, H3K4me1, and H3K27ac ChIP-seq datasets for ten cell lines from public databases (NCBI GEO/SRA, ENCODE, and EGA). Raw reads were processed following ENCODE guidelines (https://www.encodeproject.org/chip-seq/histone-encode4/): adapter sequences and low-quality bases were trimmed using Trimmomatic (v0.36), and the remaining high-quality reads were aligned to hg38 using BWA (v0.7.17). Duplicate reads were removed with Picard, and only unique, non-duplicate reads were retained. Peak calling was performed using MACS2 (v2.2.9.1) with an FDR threshold of 0.01. Promoters were defined as H3K4me3 peaks within ±5 kb of transcription start sites (TSSs). Enhancers were identified as H3K27ac peaks located outside ±5 kb of TSSs; peaks within 12.5 kb of each other were stitched together. Super-enhancers (SEs) were distinguished from typical enhancers (TEs) using the ROSE algorithm, based on the rank-ordering of H3K27ac signal intensity.
3. Identification of high-confidence EPRIs
The EPRIs were identified using the following pipeline (Figure 1).
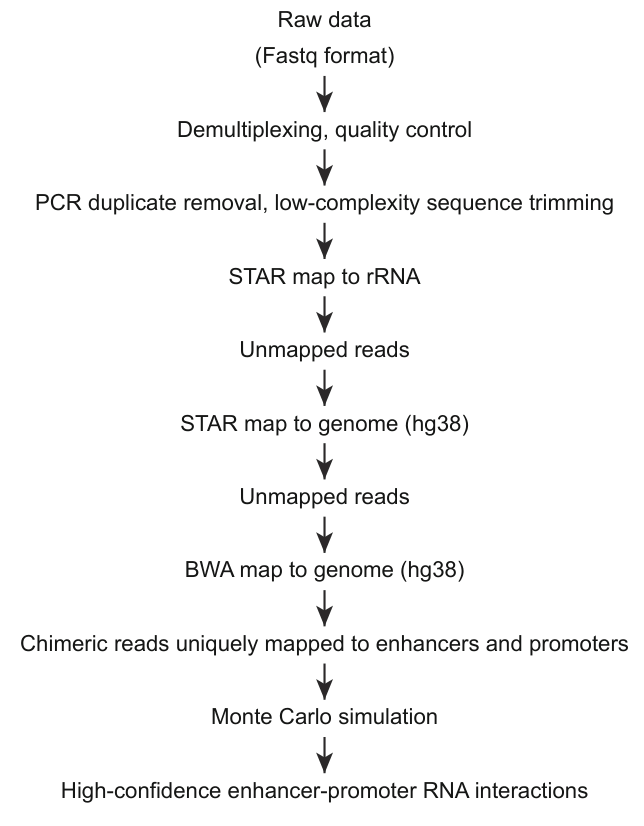
Figure 1: The identification pipeline of enhancer-promoter RNA interactions.
Adapter sequences were trimmed from raw reads using Trimmomatic (v0.36), followed by PCR duplicate removal using in-house scripts. Poly(N) tails at the 3′ ends were removed with Cutadapt (v4.1). Processed reads were first aligned to the human pre-rRNA reference using STAR (v2.5.2b). Unmapped reads were then aligned to the human reference genome (hg38) using STAR for chimeric junction detection. Remaining unmapped reads were subsequently re-aligned to hg38 using BWA (v0.7.17). All intermolecular chimeric reads from both STAR and BWA alignments were combined for downstream analysis.
Chimeric reads with both arms uniquely aligned (MAPQ ≥ 20) to enhancer or promoter regions were retained as candidate EPRIs. To define high-confidence interactions, a Monte Carlo simulation framework was employed to assess statistical significance relative to random ligation events. Specifically, 100,000 random simulations were performed to model the expected background interaction frequency. For each candidate EPRI, a local background-corrected P-value was calculated by comparing the observed contact count to the simulated distribution. Only interactions with a corrected P-value below 0.05 and supported by at least two unique chimeric reads were considered significant EPRIs.
4. Mapping of genetic variants
To assess the disease and trait relevance of the identified EPRIs, we collected genetic variants from multiple public databases. Specifically, we retrieved all variants from the GWAS Catalog, along with pathogenic or likely pathogenic variants from ClinVar. In addition, cancer-associated variants were sourced from the ICGC database, and high-quality variants passing quality filtering (score > 15) and mutant allele frequency thresholding (MAF > 0.1) were retained. In total, 5,744,066 genetic variants were obtained from these resources. Finally, we intersected these risk variants with the EPRI regions using BEDTools.
5. Search page
The EP-Atlas web interface is easy to use. We provided three flexible search options to search the data.
1) Promoter-based search by gene symbol or Ensembl ID.
2) Enhancer-based search using enhancer name or enhancer region.
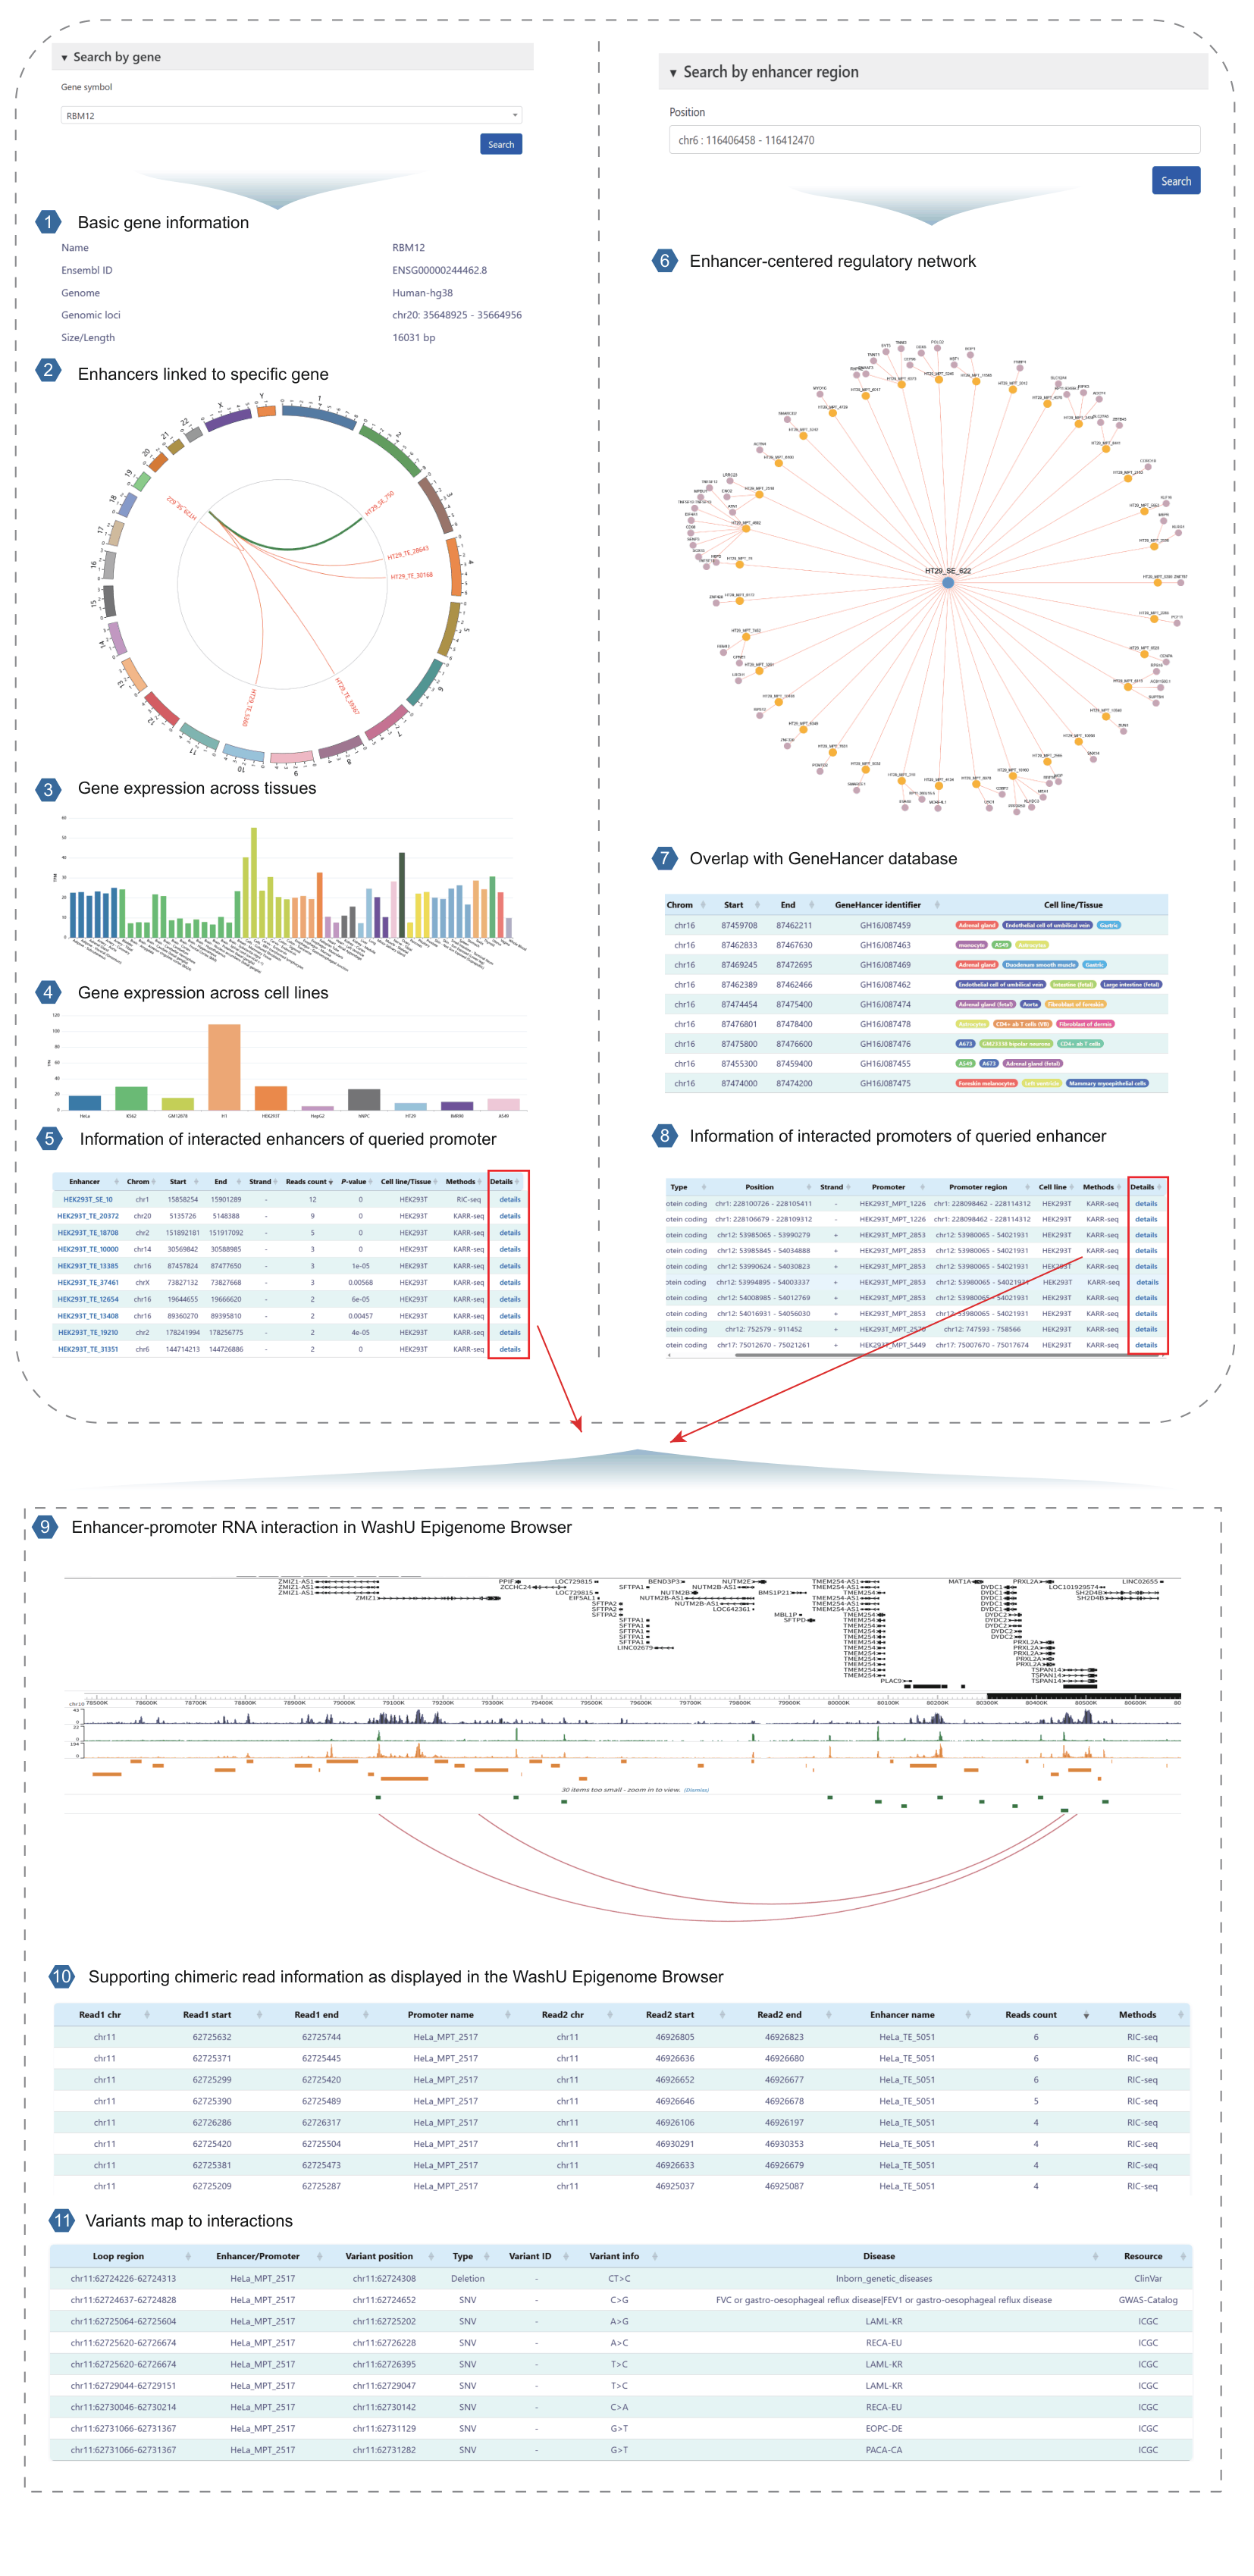
Figure 2: Schematic diagram showing how to search the database and read the results.
6. Results page
Section 1: Basic gene information
This section displays detailed information for each gene, including name, Ensembl ID, genome version, genomic coordinates, and gene length.
Section 2: Enhancers linked to specific gene
The Circos plot displays all enhancers linked to the queried gene as detected in the selected cell line.
Section 3: Gene expression across tissues
The bar plot shows the expression levels of the queried gene across different tissues, as extracted from the GTEx database.
Section 4: Gene expression across cell lines
The bar plot shows the expression levels of the queried gene across different cell lines, as extracted from the NCBI GEO database.
Section 5: Information of interacted enhancers of queried promoter
This section provides details of the enhancers interacting with each gene. Each row represents one interaction, including the promoter ID, coordinates, strand, supporting chimeric read count, p-value, cell line, and detection method.
Section 6: Enhancer-centered regulatory network
This section shows the cell-type-specific regulatory network of the queried enhancer, along with all detected interacting promoters and target genes.
Section 7: Overlap with GeneHancer database
This section shows the overlap between the queried enhancer and enhancers in the GeneHancer database.
Section 8: Information of interacted promoters of queried enhancer
This section provides details of the promoters interacting with the queried enhancer. Each row represents one interaction and includes the gene symbol, gene type, gene coordinates, strand, promoter ID, promoter coordinates, cell line, and detection method.
Section 9: Enhancer-promoter RNA interaction in WashU Epigenome Browser
This screenshot shows multi-omic genomic tracks at a representative locus. From top to bottom: Gencode gene annotations, three histone modification tracks reflecting enhancer and promoter chromatin states, and red arcs highlighting high-confidence EPRIs.
Section 10: Supporting chimeric read information as displayed in the WashU Epigenome Browser
This table displays supporting chimeric read information for detected EPRIs from multiple RNA interactome methods, including the interacting regions of promoters and enhancers, read counts, and the detection method used.
Section 11: Variants map to interactions
This section displays two types of variants overlapping enhancer–promoter RNA interaction sites: (1) genetic variants curated from the GWAS Catalog, ClinVar, and ICGC databases, and (2) eQTLs from PanQTL v2 and ncRNA-eQTL databases.