About
Introduction of EP-Atlas
EP-Atlas is a resource-based database that focuses on RNA-mediated enhancer–promoter (eRNA–uaRNA) interactions (EPRIs), which play a key role in the cis-regulatory control of spatiotemporal gene expression. Understanding these interactions is critical for deciphering the regulatory logic of gene expression. To support this, EP-Atlas integrates high-throughput RNA–RNA interaction datasets—including RIC-seq, KARR-seq, and PARIS—to identify 360,261 high-confidence EP pairs. Each interaction is richly annotated with genomic and functional information, including chromatin states, gene expression profiles, RNA-binding protein (RBP) binding sites, and overlaps with disease-associated variants from GWAS studies.
Data process workflow
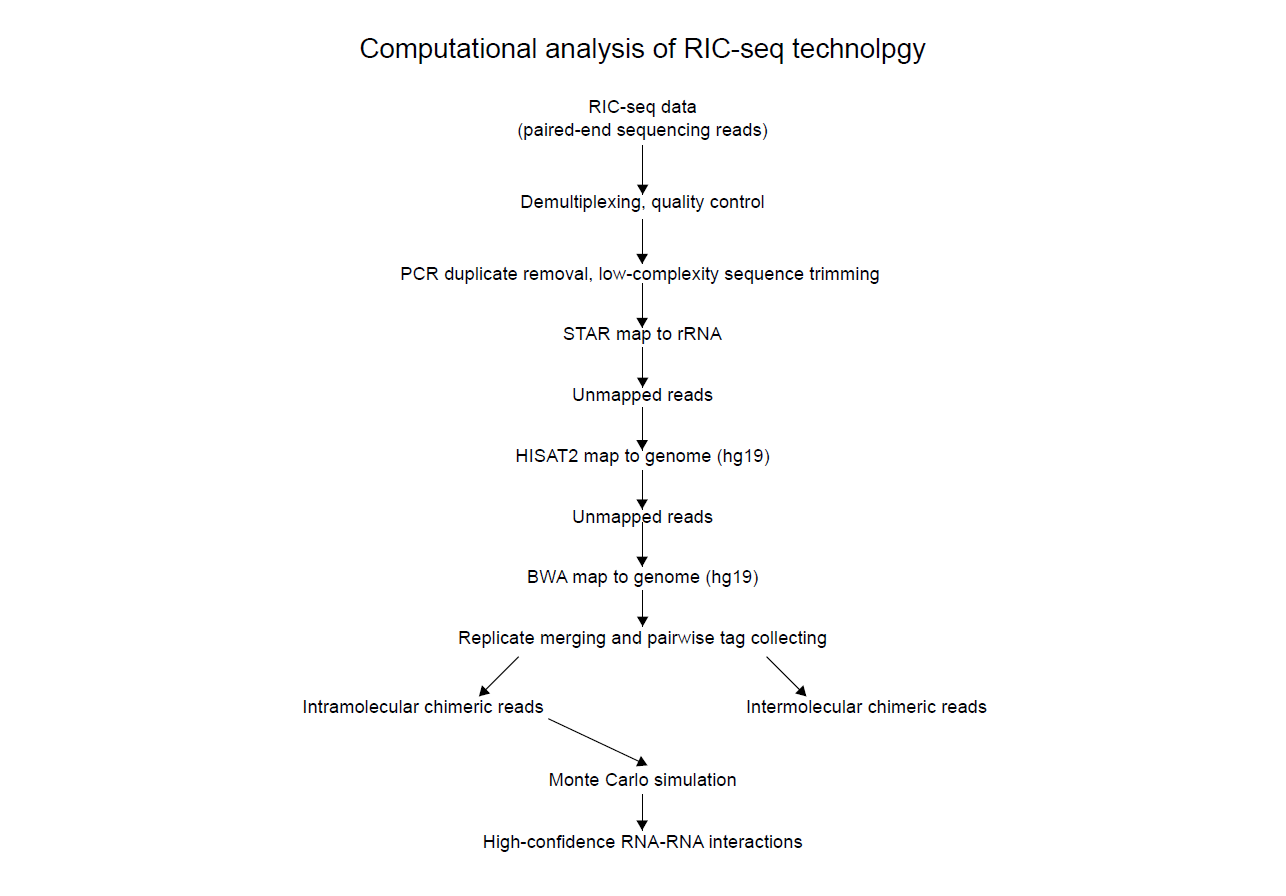
The analysis strategy is illustrated above. Adapters were trimmed off with the Trimmomatic program (v.0.36)36, and PCR duplicates were removed by homemade scripts.
After filtering, the paired reads were first aligned to 45S pre-rRNA, and the remaining reads were mapped to the human reference genome (assembly version: hg19) using the STAR software.
The STAR, HISAT2 and BWA mapping produced normally mapped reads and chiastically mapped reads. The low-quality and secondary mapping results were filtered using the SAMtools package. We next extracted the gapped reads from the normally mapped reads and further discarded the reads resulting from RNA splicing.
And the chiastically mapped reads and remaining gapped reads constituted the set of chimeric reads representing useful data for determining RNA structures and RNA – RNA interactions.
Definition of enhancer and promoter
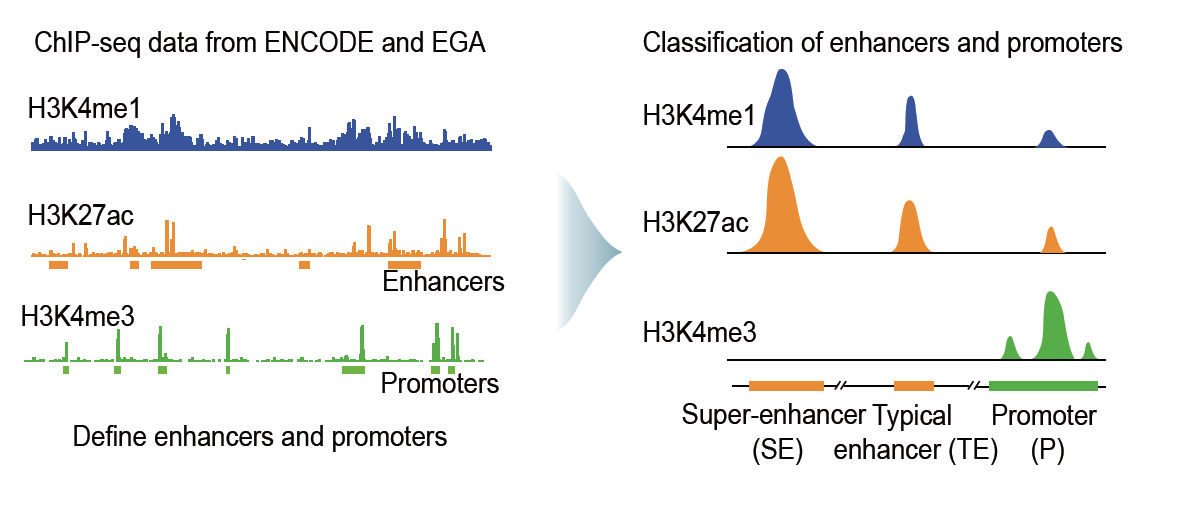
Promoters were defined as the H3K4me3 ChIP–seq peak-enriched regions within ±5 kb of the transcription start sites.
To define enhancers, we first removed the H3K27ac ChIP–seq peaks within ±5 kb of known gene promoters and then stitched the remaining H3K27ac peaks clustered within a 12.5-kb region together and classified them as enhancers.
Super-enhancers were defined based on the coverage of H3K27ac ChIP–seq signals using a Rank Ordering of Super-Enhancers (ROSE) algorithm. EPRIs were identified as pairwise interacting RNA fragments transcribed from those enhancer and promoter regions.
Obtain high-confidence E-P interactions
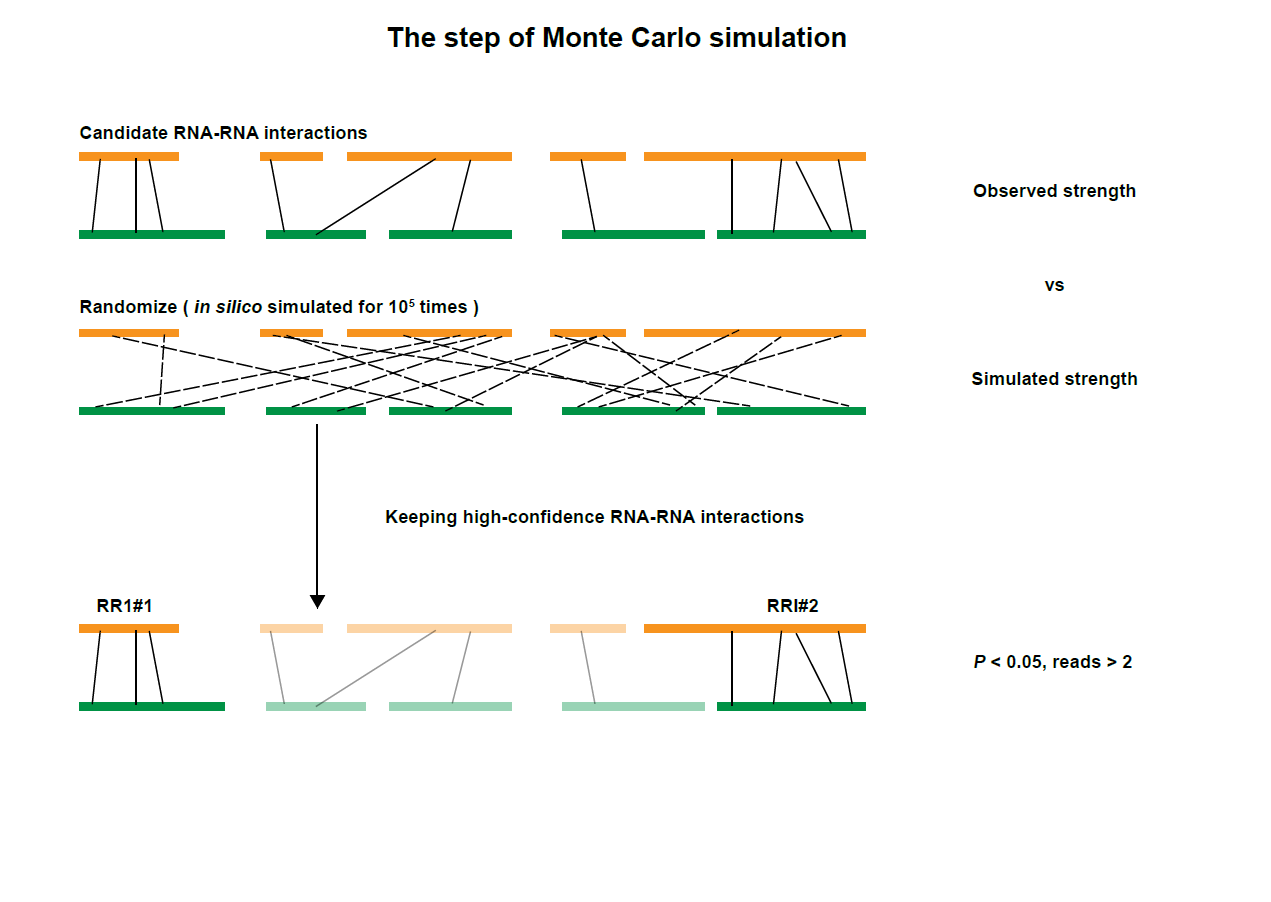
After obtaining Enhancer-Promoter interactions, we adopted a previously described Monte Carlo simulation to detect significant contacts by comparing observed pairwise interactions to the counts of random ligations, in which 100,000 simulations were performed. Enhancer-Promoter interactions with local-background-corrected P values lower than 0.05 were used in this database.
The figure above showed the diagram of strategies for defining enhancer and promoter regions, assigning chimeric reads to enhancer-promoter pairs, and identifying high-confidence Enhancer-Promoter RNA interactions (EPRIs).
Citations
Cai, Z. et al. RIC-seq for global in situ profiling of RNA–RNA spatial interactions. Nature 582, 432–437 (2020). https://doi.org/10.1038/s41586-020-2249-1
Liang, L., Cao, C., Ji, L. et al. Complementary Alu sequences mediate enhancer–promoter selectivity. Nature 619, 868–875 (2023). https://doi.org/10.1038/s41586-023-06323-x
Wu, T., Cheng, A.Y., Zhang, Y. et al. KARR-seq reveals cellular higher-order RNA structures and RNA–RNA interactions. Nat Biotechnol 42, 1909–1920 (2024). https://doi.org/10.1038/s41587-023-02109-8
Lu, Zhipeng et al. RNA Duplex Map in Living Cells Reveals Higher-Order Transcriptome Structure. Cell, Volume 165, Issue 5, 1267 - 1279. https://doi.org/10.1016/j.cell.2016.04.028